
Shop Prices Are Rising Again: What the August Figures Actually Mean for Your Trolley
Shop prices rose 1.5% in the year to August, the fastest in over two years and up from 0.9% in July. Food did most of the work at 2.8%. Here is where the increases actually landed, and the two categories where you can still do something about it.
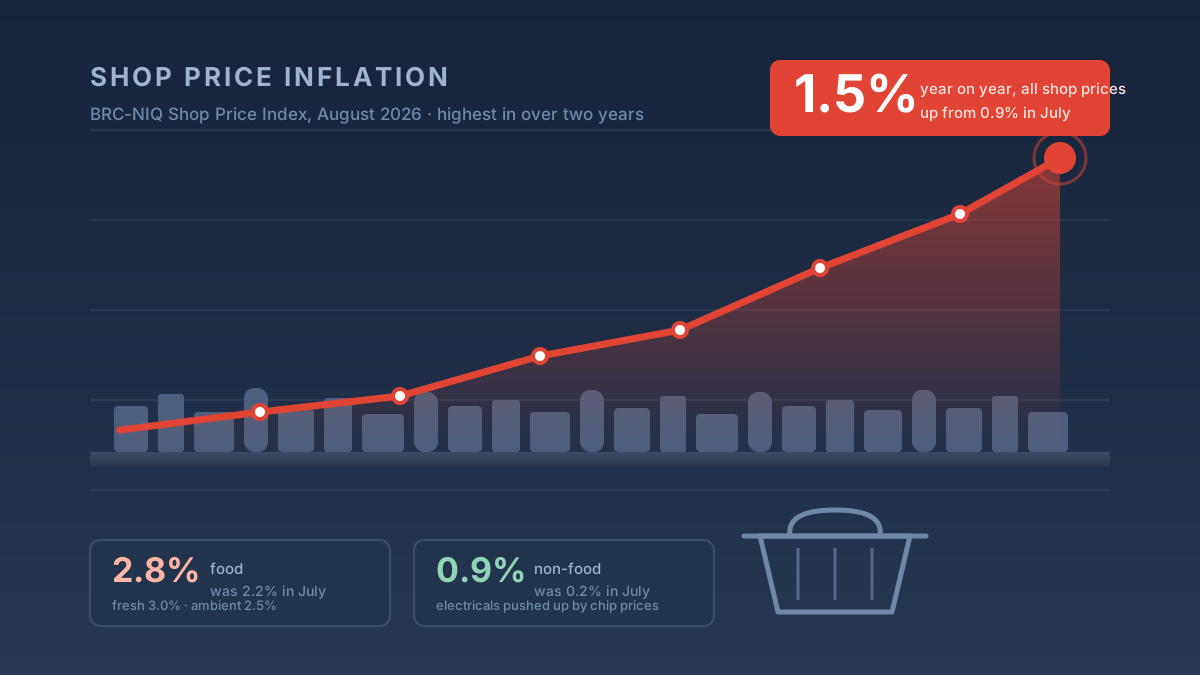
The August 2026 figures, and what moved
| Figure | Value | What it means |
|---|---|---|
| All shop prices | +1.5% year on year | Up from 0.9% in July. The highest reading in over two years. |
| Food | +2.8% | Up from 2.2% in July. This is the number doing the damage to a weekly shop. |
| Fresh food | +3.0% | Slightly down from 3.1% in July — the one line that eased. |
| Ambient food | +2.5% | Up from 1.1% in July. More than doubled in a month: tins, jars, packets, cupboard staples. |
| Non-food | +0.9% | Up from 0.2% in July. Still the cheaper half of the basket, but no longer flat. |
| Who publishes it | BRC-NIQ Shop Price Index | The British Retail Consortium with NIQ. It tracks shop prices, which is not the same as the ONS inflation figure. |
What happened
The British Retail Consortium and NIQ publish a monthly index of what things actually cost in shops, and the August 2026 reading came in at 1.5% up on a year earlier. That is the highest in over two years, and a sharp step up from July's 0.9% — the rate has not so much crept as jumped.
Food is where it happened. Food inflation went from 2.2% to 2.8%. Underneath that, the two halves moved in opposite directions: fresh food actually eased slightly, from 3.1% to 3.0%, while ambient food more than doubled, from 1.1% to 2.5%. Ambient is the cupboard — tins, jars, pasta, cereal, coffee, cleaning products. It is the part of a shop people restock in bulk and notice least, which is exactly why a jump of that size matters.
Non-food rose too, from 0.2% to 0.9%. Helen Dickinson, the BRC's chief executive, put the general cause plainly: “The impact of higher energy, input and commodity costs is beginning to filter through into prices.” On non-food specifically she pointed at something more particular — “electrical prices rose amid the ongoing AI boom, which is forcing up the price of memory chips and storage”. If you have been pricing a laptop, a phone or an SSD and wondering why the bargains dried up, that is the reason.
Mike Watkins, NIQ's head of retailer insight, offered the counterweight: “Retailers continue to keep prices low, helping consumers manage rising household costs such as energy and fuel.” Read that as what it is — a measured way of saying the increases could have been larger, which is true and is also not much comfort at a till.
What this means if you shop there
Your cupboard shop is the one that got more expensive. The instinct when prices rise is to look at fresh food, because that is where you see the labels change. This month fresh is the line that eased. The 2.5% is in ambient — the bulk buy, the multipack, the thing you replace monthly rather than weekly. If you are going to change one habit, changing where you buy tins and dry goods will do more than switching your veg.
Electricals are the surprise, and waiting will not help. Memory and storage prices are being pushed up by AI demand, which is a supply story rather than a retail one. A laptop, phone or drive that looks dear now is not obviously going to look cheaper in three months. That is the opposite of the usual advice to wait for a sale, and it is worth knowing before you hold off.
1.5% is still low by recent standards. It is a two-year high, and two years ago we were coming down from a much worse place. This is not a return to 2022. It is prices starting to climb again after a flat spell, which changes whether stockpiling a bargain is worth it — and not much else.
Do not confuse this with "inflation" on the news. The BRC-NIQ index measures shop prices only. The ONS figure covers rent, energy, transport and services too, and it is usually the higher number. If the two seem to disagree, they are measuring different things rather than one of them being wrong.
Checked on 1 September 2026. A story this recent moves — we update this box rather than leaving it to rot.
Where this came from
- British Retail Consortium and NIQ The Shop Price Index itself — the source of every figure on this page, published 1 September 2026 for August · August 2026 data
- ESM Magazine Full breakdown of the headline, food, fresh, ambient and non-food figures with the July comparisons, and the BRC and NIQ quotes · 1 September 2026
- Retail Gazette Trade coverage of the same release, which is where we picked the story up · 1 September 2026
What we could not check
- The BRC-NIQ index is an industry measure produced by the retail trade body with a market research firm. It is widely used and quoted, but it is not an official statistic and it is not audited the way ONS figures are.
- These are national averages across a basket of goods. Your own shop can move very differently depending on where you buy and what you buy, and a 2.8% average tells you nothing about any single product.
- We have not seen the underlying methodology or the basket composition, so we cannot say how much of the ambient jump is one category doing something unusual rather than a broad rise.
- The chip-price explanation for electricals is the BRC chief executive’s attribution. It is plausible and widely reported, but we have not independently verified the link between memory prices and UK shelf prices.
Company figures are as reported by the businesses themselves or their administrators. Where two sources disagree, this page says so rather than picking one.